Title:
Single-cell analysis of innate spinal cord regeneration identifies intersecting modes of neuronal repair
Journal Name & Publication Year:
Nature Communications, 2024
First and Last Authors:
Vishnu Muraleedharan Saraswathy, Mayssa H. Mokalled
First Affiliations:
Department of Developmental Biology, Washington University School of Medicine, St. Louis, MO, USA
Abstract:
In this study, the authors analyzed the process of spinal cord regeneration in adult zebrafish in detail over six weeks using single-nucleus RNA sequencing, and revealed that neurogenesis and neuronal plasticity cooperate to promote spinal cord repair. They found that the generation of excitatory and inhibitory neurons restores the post-injury excitatory/inhibitory balance, and that a transient population of injury-responsive neurons (iNeurons) exhibits plasticity one week after injury. iNeurons are injury-surviving neurons that show neuroblast-like gene expression after injury, and they were shown to be essential for functional recovery. This study provides a comprehensive resource of the cells and mechanisms that guide spinal cord regeneration, establishing zebrafish as a model of plasticity-driven neuronal repair.
Background:
Spinal cord injury (SCI) in mammals triggers a complex multicellular response that impedes regeneration and results in permanent functional impairment. Unlike mammals, adult zebrafish have the ability to recover spontaneously from severe SCI. This study proposes the importance of a comprehensive and simultaneous analysis of neural and non-neural cells in order to understand and manipulate the intercellular interactions after SCI.
Methods:
After spinal cord injury in adult zebrafish, nuclei were isolated at 0, 1, 3, and 6 weeks, and single-nucleus RNA sequencing was performed using the 10x Genomics platform. Alignment was carried out against the zebrafish genome, and data analysis was performed using the Seurat package.
Results:
The regeneration and plasticity of neurons at different stages of spinal cord regeneration were revealed, confirming the recovery of the excitatory/inhibitory balance, the discovery of injury-responsive neurons (iNeurons), and that these are essential for functional spinal cord repair.
Discussion:
This study demonstrates that zebrafish are an important model for regeneration-driven neuronal repair and provides a foundation for a comprehensive understanding of the mechanisms of regeneration and plasticity.
Novelty compared to previous studies:
Previous zebrafish studies were limited to immune cells and motor neurons, but this study comprehensively analyzed the regenerative capacity of adults and elucidated a new mechanism by which neurogenesis and plasticity cooperate to promote spinal cord repair.
Limitations:
The data in this study lack spatial information, and further research is needed for application to mammals.
Potential Applications:
In regenerative medicine and neuronal repair, the findings from the zebrafish model may be applicable to mammals.
Changes in Microglia, etc.:
This study analyzes the role and changes of microglia and other immune cells in zebrafish after SCI (spinal cord injury). The main points are summarized below.
- Microglial response:
Microglia are activated in the early stages after spinal cord injury and contribute to the inflammatory response at the injury site. The proportion of microglia increases sharply in the first week, and then gradually decreases by the sixth week. - Diversity of immune cells:
The single-nucleus RNA sequencing results identified diverse immune cell populations after spinal cord injury, including microglia, macrophages, T cells, B cells, and neutrophils. In particular, the interaction between microglia and macrophages is suggested to play an important role in the regeneration process. - Microglial function:
Microglia contribute to the removal of debris at the injury site and to maintaining the environment necessary for neuronal regeneration. In addition, analysis using CRISPR/Cas9 technology showed that microglia are also involved in the regulation of neuronal plasticity. - Changes in gene expression:
Gene expression analysis of microglia confirmed that specific genes related to the injury response and regeneration are upregulated after injury. These include inflammation-related genes and genes involved in neuroprotection.
These results show that microglia play an important role in the early stages of spinal cord regeneration and modulate the post-injury immune environment.
How it was demonstrated, using CRISPR/Cas9 technology, that microglia are involved in the regulation of neuronal plasticity:
In this study, CRISPR/Cas9 technology was used to knock out specific genes from zebrafish microglia, thereby verifying what role those genes play in neuronal plasticity and spinal cord regeneration. The method and results are described in detail below.
- Selection of target genes:
- The researchers selected, from among the genes expressed in microglia, those considered most likely to be involved in neuronal plasticity. Single-cell RNA sequencing data were used for this selection.
- Knockout by CRISPR/Cas9:
- The selected genes were introduced into zebrafish embryos using the CRISPR/Cas9 system to knock out the specific genes. This produced zebrafish in which the relevant genes do not function.
- Evaluation of neuronal regeneration and plasticity:
- After the knockout zebrafish underwent spinal cord injury, their regenerative capacity and neuronal plasticity were evaluated. This included the progression of neurogenesis during the regeneration process, the reconstruction of neurons at the injury site, and synapse formation.
- Observation of results:
- The researchers found that when microglia-specific genes were knocked out, neuronal plasticity declined and spinal cord regeneration did not proceed normally. Specifically, axonal regeneration of neurons was suppressed, and synapse formation was confirmed to be delayed.
- Furthermore, the knockout was also observed to cause the inflammatory response at the injury site to persist abnormally
long, impairing neuroprotective function.
- Conclusion:
- These results showed that microglia not only modulate the inflammatory response at the injury site but also play an important role in the regulation of neuronal plasticity. It was suggested that microglia may provide molecules essential for promoting synapse reformation and axonal regeneration.
About the genes considered most likely to be involved in neuronal plasticity:
In this study, in order to identify genes involved in spinal cord regeneration and neuronal plasticity in zebrafish, single-cell RNA sequencing data were analyzed, with particular attention to genes expressed in microglia. Among these, the following genes were considered most likely to be involved in neuronal plasticity.
- gap43 (Growth Associated Protein 43):
- Function: gap43 encodes a protein that plays an important role in axonal regeneration and neuronal growth. This gene is abundant in the growth cones of neurons and is associated with neuronal regeneration and synaptic plasticity.
- atf3 (Activating Transcription Factor 3):
- Function: atf3 is a stress-response gene whose expression is upregulated after neuronal injury. This gene is involved in the survival and regeneration of neurons and plays a role in supporting the repair process at the injury site.
- nrg1 (Neuregulin 1):
- Function: nrg1 is a growth factor that mediates signal transduction between neurons and promotes axonal regeneration and synapse formation. It also plays a role in inducing the differentiation of oligodendrocyte precursor cells and supporting neuronal regeneration.
- vamp4 (Vesicle-associated membrane protein 4):
- Function: vamp4 is involved in the membrane fusion of synaptic vesicles and regulates the release of neurotransmitters. This enables synaptic plasticity and the reconnection of neurons.
- syt11 (Synaptotagmin 11):
- Function: syt11 is involved in the exocytosis of synaptic vesicles and plays an important role in signal transduction between neurons. This regulates neuronal plasticity.
These genes are thought to contribute to neuronal plasticity in microglia and other neurons, and in this study, it was confirmed that gap43 and atf3 in particular play important roles in neuronal regeneration after spinal cord injury.
About the single-nucleus RNA sequencing (Single-Nuclear RNA Sequencing) method:
In this study, in order to analyze the regeneration process of zebrafish after spinal cord injury, single-nucleus RNA sequencing was performed according to the following procedure.
- Sample Preparation:
- Spinal cord injury: Spinal cord injury was performed on adult zebrafish, and the spinal cord tissue around the injury site (a section of approximately 3 mm) was collected at the time points of 1 week (1 wpi), 3 weeks (3 wpi), and 6 weeks (6 wpi) afterward.
- Nuclear Isolation: The spinal cord tissue obtained from the injury site was processed and the cell nuclei were isolated. Nuclear isolation includes a lysis process that disrupts the cell membrane.
- Library Preparation:
- RNA was extracted from the isolated nuclei, and a sequencing library was created using the 10x Genomics platform. This platform barcodes the RNA obtained from individual nuclei so that the RNA profile of each individual cell nucleus can be identified in subsequent analysis.
- Sequencing:
- The sequencing library that was created was sequenced using 10x Genomics 3′ v3.1 chemistry. This obtained the RNA sequences of the genes expressed from each nucleus.
- Data Alignment and Analysis:
- The obtained RNA sequencing data were aligned to the zebrafish genome (GRCz11). The aligned data were analyzed using the Seurat package, and cell clustering and the identification of expression profiles were carried out.
- Data filtering: Furthermore, the Decontx and DoubletFinder packages were used to remove droplets containing doublets and samples containing a high amount of ambient mRNA.
- Clustering and Cell Type Identification:
- Based on the obtained sequencing data, 24 cell clusters were identified, and the cell types were identified based on the gene expression profile of each cluster. These include major spinal cord cells such as microglia, oligodendrocytes, and neurons.
Through this series of methods, the cells involved in regeneration after spinal cord injury in zebrafish and their dynamics were analyzed in detail.
Details of the Nuclear Isolation process:
The nuclear isolation performed in this study was carried out to isolate cell nuclei from the spinal cord tissue obtained after spinal cord injury in zebrafish. The detailed steps of this process are as follows.
- Tissue Dissociation:
- Tissue collection: The spinal cord tissue recovered after injury is first washed with ice-cold PBS (phosphate-buffered saline) to remove impurities and blood.
- Dissociation: Next, the tissue is mechanically minced finely, after which enzymatic dissociation is performed. Commonly used enzymes include collagenase and protease, by which the extracellular matrix is broken down and the cells are individually separated.
- Nuclear Extraction:
- Disruption of the cell membrane: In order to isolate the nuclei from the dissociated cells, the cell membrane is disrupted. In this step, a surfactant (for example, Triton X-100 or NP-40) is used to disrupt the cell membrane and expose the cell nuclei. This process is usually carried out at low temperature (4°C or below), with care taken to preserve the structure of the nuclei.
- Precipitation of the nuclei: After the cell membrane has been disrupted, the sample is centrifuged to obtain a pellet containing the nuclei. The pellet may contain, along with the nuclei, other large organelles of the cell, but the nuclei are the main component.
- Nuclear Purification:
-
Filtering: The obtained nuclear pellet is further filtered for purification. Generally, filter paper or a porous filter is used to remove cellular debris and organelles.
-
Additional washing: As needed, the nuclei are further washed to increase purity. In this washing process, PBS or a special nuclear preservation buffer may be used.
- Quality Control:
- Evaluation of the nuclei: The isolated nuclei are evaluated under a microscope to confirm their purity and integrity. To confirm that there is no damage to the nuclei and that a sufficient quantity has been obtained, a staining method (e.g., DAPI staining) may be used.
- Preparation for Sequencing:
- The isolated nuclei are then used for RNA extraction and the creation of a sequencing library. At this stage, the nuclei are centrifuged again and stored in a form suitable for sequencing.
Through this nuclear isolation process, the nuclei obtained from the spinal cord tissue can be subjected to RNA sequencing in a state that maintains high purity and integrity. This allows the gene expression profiles of cells after spinal cord injury to be analyzed in detail.
About the nuclear isolation kit that was used:
The name of the specific nuclear isolation kit used in this study is not described in the paper, so it is not precisely known. However, kits commonly used for nuclear isolation include the following.
- Nuclei EZ Prep Nuclei Isolation Kit (Sigma-Aldrich):
- A kit used to efficiently isolate nuclei from cells, capable of maintaining high purity and recovery rate of the nuclei.
- 10x Genomics Chromium Single Cell 3′ Kit:
- A kit used when creating a library for single-nucleus or single-cell RNA sequencing, which also includes auxiliary reagents corresponding to the nuclear isolation protocol.
- NEBNext Nuclei Isolation Kit (New England Biolabs):
- Mainly used for nuclear isolation from mammalian cells, but also applicable to other species.
To confirm the name of the kit actually used in the study, it is necessary to consult the literature or contact the researchers directly.
Number of nuclei used in the analysis:
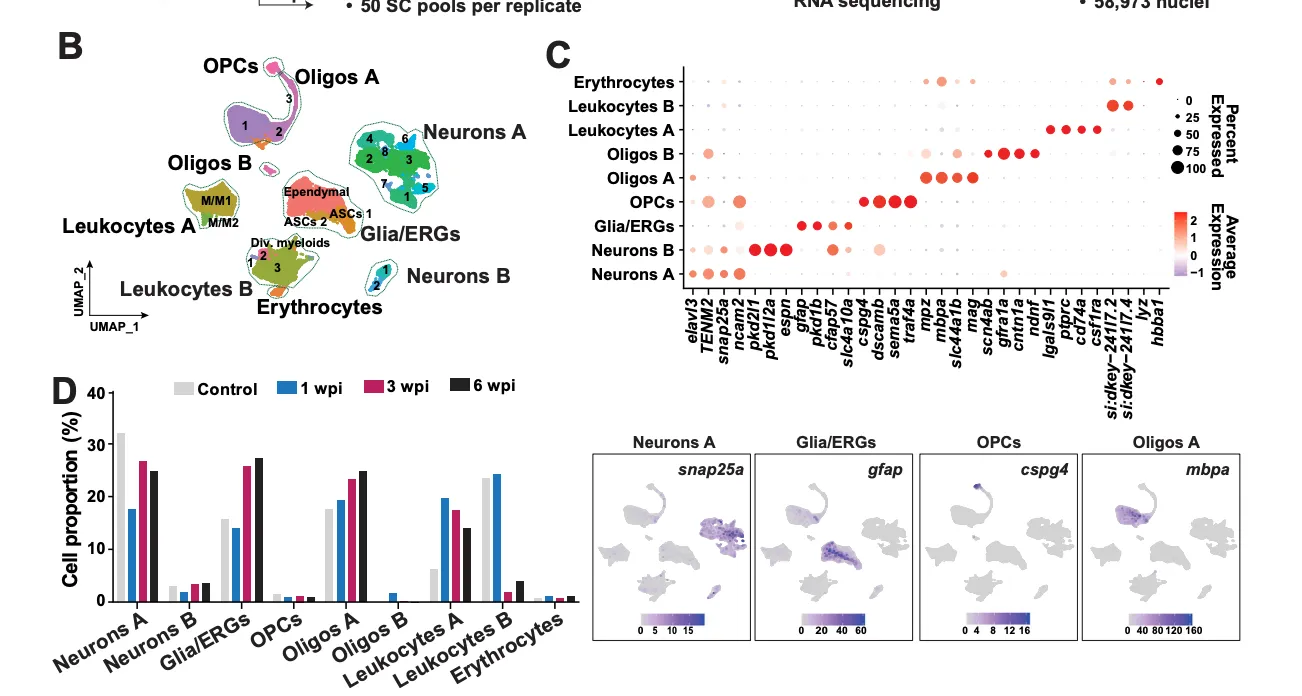
In this study, the total number of nuclei used in the analysis is 58,973. These nuclei were isolated from spinal cord tissue collected at different time points (0, 1, 3, and 6 weeks) after spinal cord injury in zebrafish.
About the number of sequencing runs:
In this study, two biological replicates were performed at each time point (0, 1, 3, and 6 weeks) for the nuclei collected from zebrafish after spinal cord injury. That is, two independent samples were analyzed at each time point, which improves the reliability of the data.
About the distinction between Neuron A and Neuron B:
Neuron A and Neuron B are distinguished by the following procedure.
- Clustering:
- Based on the single-nucleus RNA sequencing data obtained from the spinal cord tissue, clustering was performed using the Seurat package. In this clustering, cells are classified into different groups based on their gene expression patterns.
- Cell Type Identification:
- As a result of the clustering, multiple neuronal cell populations were formed. Neuron A and Neuron B are two different neuronal cell populations identified by this clustering.
- Gene Expression Analysis:
- The Neuron A and Neuron B clusters were confirmed to each have different gene expression profiles. Specifically, in Neuron A, neuronal marker genes such as elavl3 and snap25a are strongly expressed, and although these genes are similarly expressed in Neuron B as well, they are distinguished by differences in the expression of other genes.
- Classification:
- Based on the clustering and the differences in gene expression, Neuron A and Neuron B were classified as different neuronal cell types. It is thought that each cluster may have a functionally distinct role.
In this way, Neuron A and Neuron B are distinguished by clustering, based on the gene expression patterns obtained from the single-nucleus RNA sequencing data.
About the definition of Neuron:
The definition of Neuron in this study refers to a cell population that has the function of a neuron in the spinal cord regeneration process and that expresses specific neuronal marker genes.
Specifically, the expression of the following genes is included in the definition of Neuron.
- elavl3 (HuC/HuD):
- A neuron-specific RNA-binding protein, widely used as a marker of mature neurons.
- snap25a:
- A protein involved in synaptic vesicle release, which plays an indispensable role in neurotransmission.
Cells that highly express these genes are classified as Neurons. Neuron A and Neuron B are different neuronal clusters identified based on the expression of these marker genes. Each Neuron may have a different role in the process of neuronal regeneration.
About changes in the definition of Neuron:
Yes, the definition of Neuron can differ from study to study. The definition of a neuron often changes depending on the purpose of the study, the organism being studied, the technology used, and the specific cellular function or gene expression pattern being focused on.
Reasons why the definition of a neuron differs from study to study
- Purpose of the study:
- In some studies, the definition of a neuron may be based on the gene expression related to synapse formation or neurotransmission. In other studies, neurons may be defined based on the ability to produce a specific neurotransmitter or their role in the developmental process.
- Differences in organisms:
- In different animal models (for example, zebrafish, mice, humans), the functions of neurons and the genes they express differ, so the definition of a neuron may change accordingly.
- Technology and methods:
- Depending on the analysis technique used, such as single-cell RNA sequencing or single-nucleus RNA sequencing, the definition and classification method of cells change. Clustering results based on gene expression data can influence the definition of a neuron.
- Genes of focus:
- When focusing on a specific neuronal population or subtype, the gene expression pattern unique to that population may be incorporated into the definition of a neuron.
Examples
-
Definition based on developmental stage:
When studying the developing nervous system, undifferentiated neural progenitor cells may be defined as neurons, but when studying the mature nervous system, it is common for only fully differentiated neurons to be defined as neurons. -
Definition related to disease:
When studying a specific neurological disease (for example, Alzheimer’s disease), the subtype of neuron particularly affected in that disease (e.g., cholinergic neurons) may be incorporated into the definition of a neuron.
Therefore, the definition of a neuron is not uniform but is a flexible concept that is adjusted according to the purpose and conditions of the study.
About the definition of Neuronal E/I (excitatory/inhibitory balance):
Neuronal E/I (excitatory/inhibitory balance) refers to the functional balance between excitatory neurons and inhibitory neurons in the nervous system. This balance is very important for the central nervous system (CNS) to function normally, and appropriate regulation of excitation and inhibition is necessary for the control of neurotransmission.
Definition of the Neuronal E/I balance in the study
- Excitatory Neurons:
- Definition:
Neurons that mainly release the excitatory neurotransmitter glutamate (Glutamate). This promotes the firing of other neurons and activates information transmission within neural circuits. - Major marker genes:
E.g., slc17a6a (VGLUT2), slc17a6b (VGLUT1), etc.
- Inhibitory Neurons:
- Definition:
Neurons that mainly release inhibitory neurotransmitters such as γ-aminobutyric acid (GABA) and glycine (Glycine), suppressing the firing of other neurons. This suppresses excessive excitation within neural circuits and maintains the stability of the nervous system. - Major marker genes:
E.g., gad1a, gad1b (GAD67, GAD65), slc6a5 (GlyT2), etc.
Importance of the Neuronal E/I balance
- Normal brain function:
In the brain and spinal cord, the E/I balance ensures the accurate processing and transmission of information. For example, excessive excitation can cause neuronal excitotoxicity, and a lack of inhibition can cause seizures or excitability disorders. - Pathological states:
Disruption of the E/I balance is associated with neuropsychiatric disorders such as autism spectrum disorder, schizophrenia, and epilepsy. In these states, the neural circuits become abnormal due to excessive excitation or insufficient inhibition.
Methods for measuring the E/I balance in the study
- Gene expression analysis:
In this study, single-nucleus RNA sequencing was used to measure the expression levels of genes related to the excitatory and inhibitory properties of each neuron, classifying neuronal populations as excitatory or inhibitory. - Calculation of the E/I ratio:
The ratio of excitatory neurons to inhibitory neurons (E/I ratio) was calculated, and how this balance changes over time during the spinal cord regeneration process was evaluated.
In this way, the Neuronal E/I balance plays a central role in the function and health of neural circuits, and its definition is based mainly on the type of neurotransmitter that the neurons secrete.
About the Cumulative Strength of All Signaling Networks:
The Cumulative Strength of All Signaling Networks is an indicator that shows the overall strength of signal transduction between cells. It is used to evaluate the overall influence of all signal transduction pathways that a specific cell population exerts on, or receives from, other cell populations.
Specific meaning
- Strength of the signal transduction pathway:
Each signal transduction pathway involves the interaction of a ligand (the molecule that sends the signal) and a receptor (the molecule that receives the signal). The strength of these interactions indicates the extent to which a cell is sending or receiving that signal. - Cumulative strength:
“Cumulative strength” refers to the total strength, at a specific time point, of all the signal transduction pathways that a cell population is exerting on, or receiving from, all other cell populations. In other words, it is an evaluation that aggregates the strength of the individual signal transduction pathways.
Use in the study
- Evaluation of intercellular communication:
In the study, this cumulative strength is used to compare the extent to which each cell population is sending or receiving signals. This makes it possible to determine whether a specific cell population plays a central role in the signaling network. - Tracking changes over time:
For example, in the regeneration process after spinal cord injury, if a certain cell population (such as neurons or microglia) is sending strong signals to other cell populations at a specific time point, it is suggested that the cell population may play an important role in regeneration.
Examples
- Cumulative strength of Neuron A and B:
If Neuron A shows strong cumulative strength across multiple signal transduction pathways, this indicates that Neuron A is sending powerful signals to other cell populations. In contrast, if Neuron B has a similar cumulative strength, each neuron may have a different role. - Role in the regeneration process:
If a specific cell population shows high cumulative strength in the early stages after injury, this may indicate that the cell population is leading the early regeneration process. Conversely, if the cumulative strength increases at a later stage, it is suggested that it is involved in the completion of regeneration or the maintenance of repair.
By using this indicator, it is possible to understand the complex intercellular signaling network and to elucidate which cells play important roles in regeneration and repair.
About the quantification of signal strength:
The quantification of signal strength is an important step when analyzing signal transduction between cells, and it is usually carried out by methods such as the following.
1. Evaluation of ligand-receptor interactions
- Expression levels of ligands and receptors:
From single-cell RNA sequencing data, the gene expression amounts of the ligand (the molecule that sends the signal) and the receptor (the molecule that receives the signal) expressed in each cell are obtained. When both the ligand and the receptor are expressed between specific cells, the possibility of signal transduction between those cells is indicated.
2. Estimation of the signal transduction pathway
- Construction of the signal transduction network:
Multiple ligand-receptor interactions are integrated to model which cell populations are sending signals to which other cell populations via which signal transduction pathways. For this, bioinformatics tools that use gene expression data are employed.
3. Scoring for quantification
-
Signal strength score:
Signal strength is scored by combining the expression levels of the ligand and the receptor. Generally, calculations such as the following are performed.- For each ligand-receptor pair, the product of the expression amounts of the ligand and the receptor is calculated.
- These products are aggregated to obtain the sum total of all ligand-receptor interactions between cells.
-
Communication probability:
Some tools (e.g., CellChat) calculate the communication probability between cells based on these scores. This communication probability serves as an indicator of the likelihood that a certain cell population is sending a signal to another cell population.
4. Calculation of cumulative strength
- Calculation of total signal strength:
The scores calculated for all ligand-receptor interactions are accumulated to obtain the total strength of signal sending or receiving for that cell population as a whole. This becomes the “Cumulative Strength.”
5. Visualization of the analysis results
- Heatmaps and network diagrams:
The obtained signal strength is visualized as a heatmap or network diagram to clarify which cell populations are mainly sending or receiving signals. This allows the structure of the entire signaling network and the important signal pathways to be understood visually.
Examples of tools and methods
- CellChat:
An R package that analyzes the signal transduction network between cells and quantifies the communication strength and cumulative strength. - Seurat:
A tool widely used for the analysis of single-cell RNA sequencing data, which is also used for analysis of signal transduction between cells.
Summary
Signal strength is quantified based on the gene expression levels of ligands and receptors, and the strength of the entire signaling network is evaluated. This makes it possible to quantitatively understand the importance of intercellular interactions.
About the recovery of the excitatory/inhibitory (E/I) balance during spinal cord regeneration:
Regarding the recovery of the excitatory/inhibitory (E/I) balance during spinal cord regeneration, changes are observed over time. However, the recovery of the balance proceeds gradually and is ultimately adjusted to approach the pre-injury state. The main points of the study are shown below.
Main points of the study
- Early changes (1 week post-injury):
- In the first week after spinal cord injury (1 wpi), the proportion of excitatory neurons increases sharply, and the E/I balance is skewed toward excitation. At this stage, the regeneration process has just begun, and it is observed that the excitability of the neural network has increased.
- Intermediate stage (3 weeks post-injury):
- Entering the third week (3 wpi), the proportion of inhibitory neurons gradually begins to increase, and the E/I balance improves. At this stage, neuronal regeneration progresses, and the neural network becomes stable again.
- Final stage (6 weeks post-injury):
- At the sixth week (6 wpi), the proportion of inhibitory neurons increases further, and the balance of excitation and inhibition returns to a nearly normal level. At this stage, the E/I balance approaches the pre-injury state, indicating that functional recovery is progressing.
About the degree of change
- Gradual change:
The change in the E/I balance is not dramatic but is gradually adjusted over time. Therefore, although a large change may not be seen in the short term, ultimately a process in which the balance recovers is observed. - Final stabilization:
It has been shown that the E/I balance returns to normal by the sixth week, and this is thought to play an important role in functional spinal cord regeneration.
Summary
During spinal cord regeneration, the E/I balance is initially dominated by excitation, but subsequently the balance recovers due to an increase in inhibitory neurons. This process proceeds gradually as regeneration advances, ultimately approaching a normal state.
Differences and advantages of Hoechst dye and DAPI dye:
Hoechst dye and DAPI (4′,6-diamidino-2-phenylindole) are both fluorescent dyes for DNA staining that bind to DNA and emit fluorescence, and they are used to visualize cell nuclei. The differences between Hoechst and DAPI and the respective advantages of each are explained below.
Main differences between Hoechst and DAPI
- Chemical structure and emission spectrum:
-
Hoechst dye:
- There are mainly two types of Hoechst dye, Hoechst 33258 and Hoechst 33342. Both bind to AT-rich DNA sequences, are excited by ultraviolet light (around 350 nm), and emit blue (about 460 nm) fluorescence.
-
DAPI:
- DAPI also binds to AT-rich DNA sequences, is excited by ultraviolet light (around 358 nm), and emits blue (about 461 nm) fluorescence.
- The emission spectra of Hoechst dye and DAPI are very similar, and both emit similar blue fluorescence under a microscope, but because they are excited at slightly different wavelengths, differences may arise in the detection conditions.
- Cell permeability:
-
Hoechst dye:
- Hoechst 33342 readily permeates the cell membrane and can stain even living cells. For this reason, Hoechst dye is often used when observing the nuclei of living cells.
- Hoechst 33258 has low cell membrane permeability, so it is mainly used in fixed cells and tissues.
-
DAPI:
- DAPI has relatively low cell membrane permeability and is mainly used for staining fixed cells and tissues. Use in living cells is also possible, but it is less efficient than Hoechst dye.
- Toxicity:
- Hoechst dye:
- Hoechst dye has low cytotoxicity, so long-term observation in living cells is possible.
- DAPI:
- DAPI has somewhat higher cytotoxicity, so care is needed when using it in living cells. It is often used in fixed cells and tissue sections.
Advantages of Hoechst dye
- Use in living cells:
Because Hoechst 33342 readily permeates the cell membrane, it is suitable for staining living cells. This allows observation of cell nuclei in real time without fixation. - Low toxicity:
Hoechst dye has lower cytotoxicity compared to DAPI, allowing long-term observation while maintaining a high cell survival rate. - Versatility:
There are two types, Hoechst 33342 and Hoechst 33258, which can be used selectively according to the purpose. It is applicable to both living cells and fixed cells.
Advantages of DAPI
- High sensitivity:
DAPI exhibits high fluorescence intensity and enables very clear visualization of nuclei, especially in the staining of fixed tissues and cells. - Versatility:
DAPI is used as a standard DNA staining agent in many studies, and there is an abundance of widely available protocols and references.
Summary
- Hoechst dye is particularly suitable for observation in living cells, with the advantages of high cell membrane permeability and low toxicity.
- DAPI is excellent for use in fixed cells and tissues, with the advantage of being able to visualize cell nuclei clearly with high sensitivity.